4 posts tagged with "prometheus"

View All Tags

· 14 min read
Costa Tsaousis

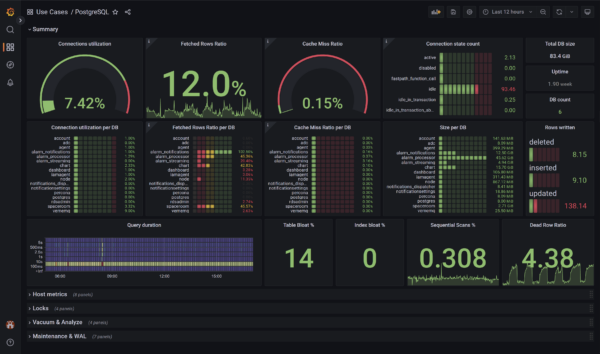
Netdata Prometheus Comparison

In an era dominated by data-driven decision making, monitoring tools play an indispensable role in ensuring that our systems run efficiently and without interruption. When considering tools like Netdata and Prometheus, performance isn't just a number; it's about empowering users with real-time insights and enabling them to act with agility.

There's a genuine need in the community for tools that are not only comprehensive in their offerings but also swift and scalable. This desire stems from our evolving digital landscape, where the ability to swiftly detect, diagnose, and rectify anomalies has direct implications on user experiences and business outcomes. Especially as infrastructure grows in complexity and scale, there's an increasing demand for monitoring tools to keep up and provide clear, timely insights.

Our ambition is to be the simplest, fastest and most scalable solution in this domain. However, it's essential to approach it with modesty. A performance comparison between Netdata and Prometheus is not a race for the top spot but an exploration of where we stand today and where improvements can be made. Through this, we hope to drive innovation, ensure optimal performance, and ultimately deliver better value to our users.
· 11 min read
Satyadeep Ashwathnarayana

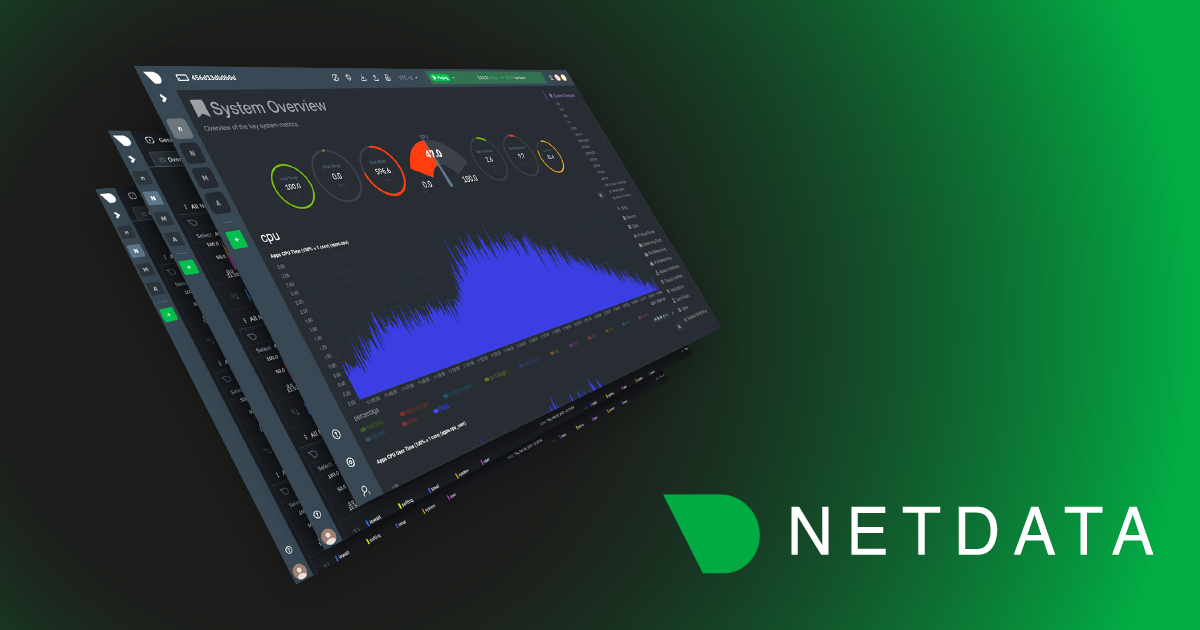
netdata-prometheus-grafana-stack

In this blog, we will walk you through the basics of getting Netdata, Prometheus and Grafana all working together and monitoring your application servers. This article will be using docker on your local workstation. We will be working with docker in an ad-hoc way, launching containers that run /bin/bash and attaching a TTY to them. We use docker here in a purely academic fashion and do not condone running Netdata in a container. We pick this method so individuals without cloud accounts or access to VMs can try this out and for it's speed of deployment.

· 4 min read
Andrew Maguire

img

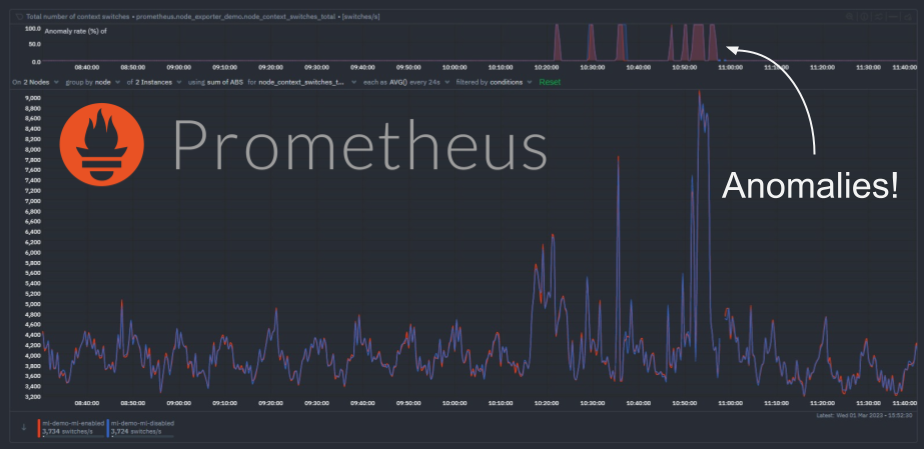
We have recently extended the native machine learning (ML) based anomaly detection capabilities of Netdata to support all metrics, regardless on their collection frequency (update every).

Previously only metrics collected every second were supported, but now Netdata can run anomaly detection out of the box with zero config on metrics with any collection frequency.

This post will illustrate an example of what this means using Prometheus metrics (via the Netdata Prometheus collector) since they typically have a default collection frequency of 10 seconds.